(UroToday.com) At the 2022 American Society of Clinical Oncology Annual Meeting held in Chicago and virtually, the poster session focused on Prostate, Testicular, and Penile cancers on Monday afternoon included a presentation from Dr. Masatoshi Hotta describing the value of tumor to salivary gland uptake on PSMA PET in predicting response to Lu-177 PSMA radioligand therapy.
There has been significant interest recently in the field of theranostics for prostate cancer. The phase II TheraP and phase III VISION trials demonstrated the benefit of 177Lu-PSMA-617 in patients with heavily pre-treated mCRPC with evidence that it PSMA prolongs survival and improves the quality of life. However, each of these trials used (somewhat different) imaging-based inclusion criteria to select patients for therapy and patients do respond uniformly. Notably, despite an overall positive overall survival benefit, only 46% of patients in the VISION trial treated with Lu-177 PSMA radioligand therapy had a PSA decline of ≥50% (PSA50). Thus, there is a need to better identify patients for this treatment approach – the authors hypothesized that using the parotid glands instead of the liver as the reference organ enables more selective stratification.

To test PSMA PET tumor-to-Salivary Glands ratio (PSG score) to predict outcomes after Lu-177 PSMA, the authors performed an international multicenter retrospective study using an established dataset consisting of 270 men with mCRPC treated with Lu-177 PSMA. They first assessed PSMA PET quantitatively, calculating the tumor-to-salivary gland ratio (qPSG score) based on uptake in the whole-body-tumor and the parotid glands (qPSG = SUVmean whole-body-tumor / SUVmean parotid glands) using a semi-automatic segmentation software (qPSMA). Using this tumor-to-salivary gland ratio, patients were divided into three groups: high (qPSG > 1.5), intermediate (qPSG = 0.5 - 1.5), and low (qPSG < 0.5).

Second, they assessed the reproducibility and the predictive value of the PSG score visually (vPSG score) graded by ten nuclear medicine physicians. Each reader read the baseline PSMA PET 3D maximum intensity projection (MIP) images, and classified the patients into three groups: (high) most of the lesions (> 80%) show higher uptake than parotid glands; (intermediate) neither “low” nor “high”; (low) most of the lesions (> 80%) show lower uptake than parotid glands. In case of disagreement, a majority vote was used.

The authors then assessed the association between these metrics and outcome measures including PSA-progression free-survival (PSA-PFS), overall survival (OS), and PSA50.
The authors examined 237 men, after excluding 33 men whose parotid glands were out of the scan range. Among these 237 men, 56 (23.6%), 163 (68.8%), and 18 (7.6%) were classified as having high, intermediate, and low qPSG scores, respectively. In the qualitative classification, 106 (44.7%), 96 (40.5%), and 35 (14.8%) men were classified as having high, intermediate, and low vPSG scores, respectively. The inter- and intra-readers reproducibility of the vPSG score showed substantial (Fleiss’ weighted Kappa: 0.68) and almost perfect (Cohen's weighted Kappa (mean): 0.83) agreement, respectively.
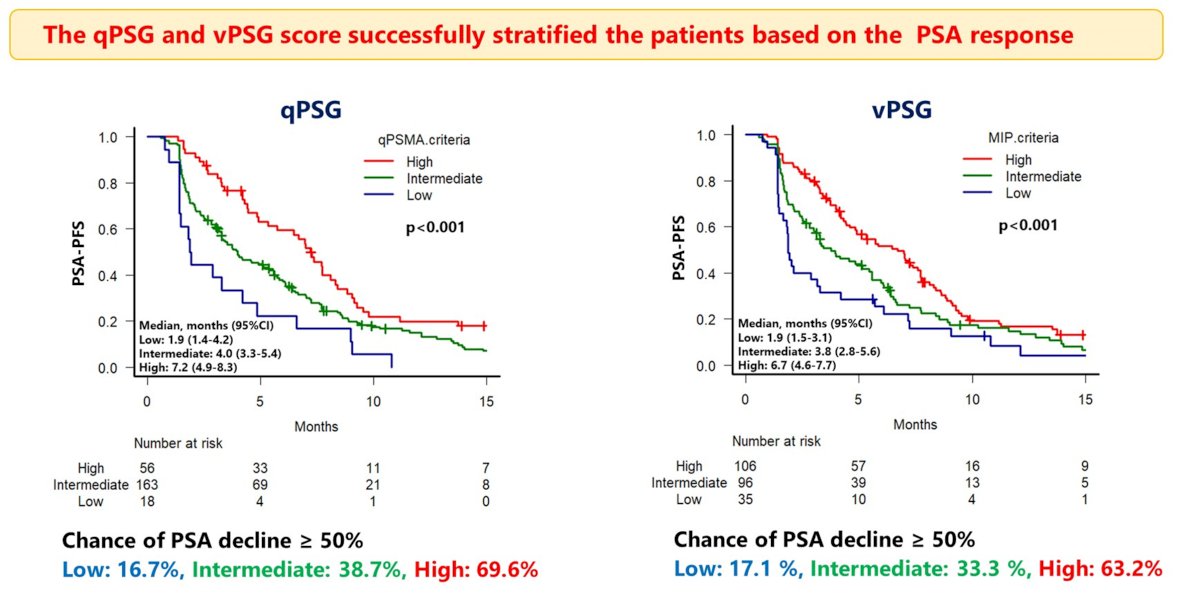
Each of these measures showed significant correlation with median PSA-PFS. Using the quantitative qPSG score, the median PSA-PFS was 7.2, 4.0, and 1.9 months for patients with high, intermediate, and low scores, respectively (p < 0.001). A similarly pattern was observed using the qualitative ranking with a median PSA-PFS of 6.7, 3.8, and 1.9 months for patients with high, intermediate, and low vPSG scores, respectively (p < 0.001). Further, higher PSA50 responses were observed in the high group followed by the intermediate and low groups using both scoring schemas (high vs intermediate vs low: [qPSG] 69.6% vs 38.7% vs 16.7%; [vPSG] 63.2% vs 33.3% vs 16.1%).
Similarly, the median OS was longer in the high group than in the intermediate + low (i.e., non-high) group by qPSG (15.0 vs. 11.7 months (p = 0.013)) and vPSG score (14.3 vs.11.0 months (p = 0.038)).

Presented by: Masatoshi Hotta, MD, PhD, University of California Los Angeles, Los Angeles, CA