(UroToday.com) The 2024 American Society of Clinical Oncology (ASCO) annual meeting held in Chicago, IL between May 31 and June 4 was host to the Rapid Oral Abstract Session: Genitourinary Cancer - Prostate, Testicular, and Penile. Dr. Wolfgang Fendler discussed the prognostic value of PSMA-PET PROMISE nomograms for patients with prostate cancer.
Prostate Specific Membrane Antigen Positron-Emission-Tomography (PSMA-PET) has revolutionized the field by providing highly sensitive and specific detection of prostate cancer lesions, even at low PSA levels, and delivering superior accuracy for prostate cancer staging.
The Prostate Cancer Molecular Imaging Standardized Evaluation (PROMISE) criteria, introduced in 2018, aim to standardize the reporting of prostate cancer molecular imaging.1,2 PROMISE outlines a molecular imaging (mi) TNM system miTNM Classification specifically for PSMA-ligand PET/CT or PET/MRI, along with a miPSMA Expression Score. This score facilitates uniform reporting of PSMA expression levels, categorizing them based on mean uptake in the blood pool, liver, and parotid gland. PSMA expression is reported as 0, 1, 2, or 3, indicating no expression, low, intermediate, or high PSMA expression, respectively. Scores of 2 and 3 are commonly associated with typical prostate cancer lesions, providing clinicians with valuable information for diagnosis and treatment planning. PSMA-PET, assessed according to the standardized PROMISE criteria, provides precise staging and holds promising prognostic value.
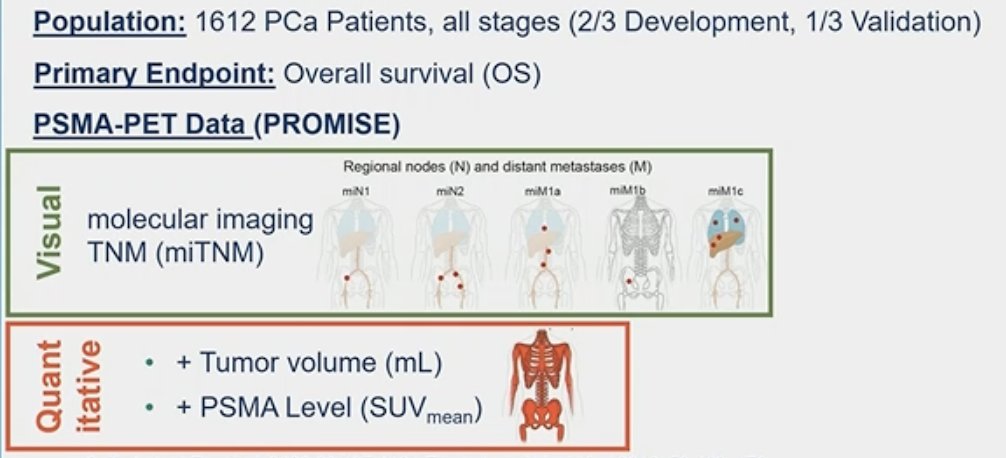
The aim of this study was to assess the prognostic value of PSMA-PET using a retrospective analysis cohort of prostate cancer patients, who underwent PSMA-PET between October 2014 and December 2019 at the Essen University Hospital in Germany. The investigators collected PSMA-PET stage using the miTNM system, tumor volume, SUVmean, and overall survival (OS) data.
This dataset was split into development and validation cohorts (2:1) and they created both a visual and quantitative nomogram based on Cox regression models with least absolute shrinkage and selection operator (LASSO) penalty regression analysis using the development cohort. In the validation cohort, the performance of nomograms was tested using C-index and calibration plots. A head-to-head comparison to clinical risk scores for each staging group was examined using ROC-curves and C-index. The clinical risk scores chosen for comparison were:
- STARCAP Nomogram
- EAU Risk group
- NCCN risk group
- GAFITA nomogram3
The entire cohort included 1,612 prostate cancer patients across all disease stages (2/3 used for development and 1/3 used for validation).
PSMA-PET-based predictors included into the quantitative PSMA-PET nomogram were:
- Tumor volume (mL)
- PSMA tumor SUVmean
PSMA-PET predictors included in the visual nomogram included:
- Molecular imaging miTNM
The median follow-up of the entire cohort was 51 months. At the time of data analysis, a total of 544 (33.7%) deaths had been recorded. The median overall survival (OS) differed significantly according to the stage of the disease, and OS Kaplan-Meier curves of different subcohorts (biochemical recurrence (BCR), non-metastatic castration-resistant prostate cancer (nmCRPC), metastatic castration-resistant prostate cancer (mCRPC), and metastatic hormone-sensitive prostate cancer (mHSPC)) are outlined in the figure below.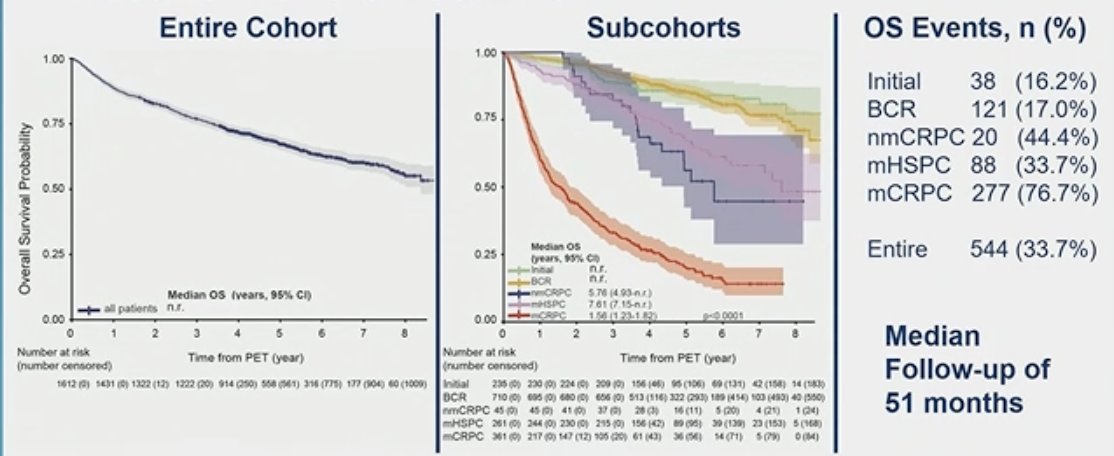
In the development cohort, using univariate Cox regression, multiple metrics were identified as significant predictors for overall survival and could potentially be included in the nomogram development. In the two figures below, all the green boxes highlight the variables that were identified as significant predictors of OS: stage T3b/T4, N2, presence of metastases regardless of location, tumor volume, tumor SUVmean, and total tumor lesion count (T+N+M).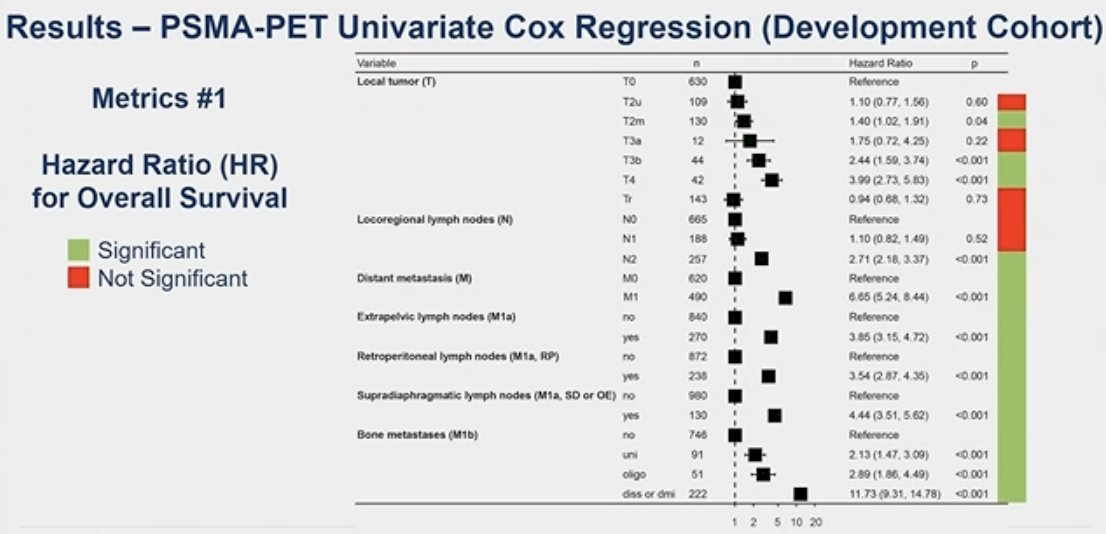

The overall C-index for the internal validation cohort was 0.81 for the quantitative metrics nomogram and 0.78 for the visual metrics nomogram. Further details are illustrated in the figure below.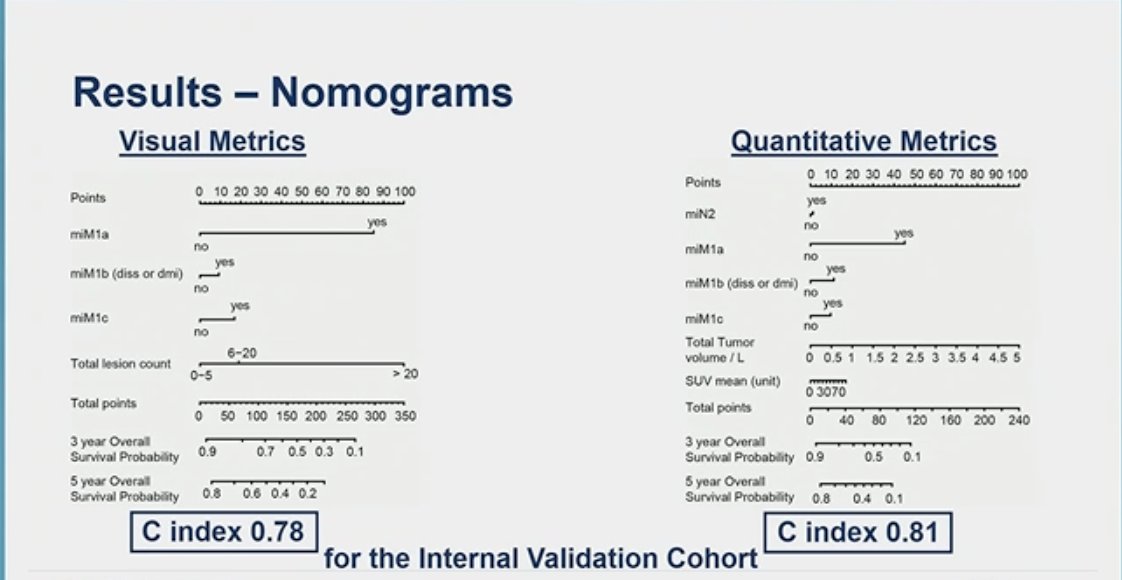
Using the PSMA PET PROMISE nomograms to classify patients as low or high-risk, significant separation of the overall survival curves could be seen in the overall population, BCR, nmCRPC,mCRPC, mHSPC, and initial diagnosis, as illustrated in the figure below.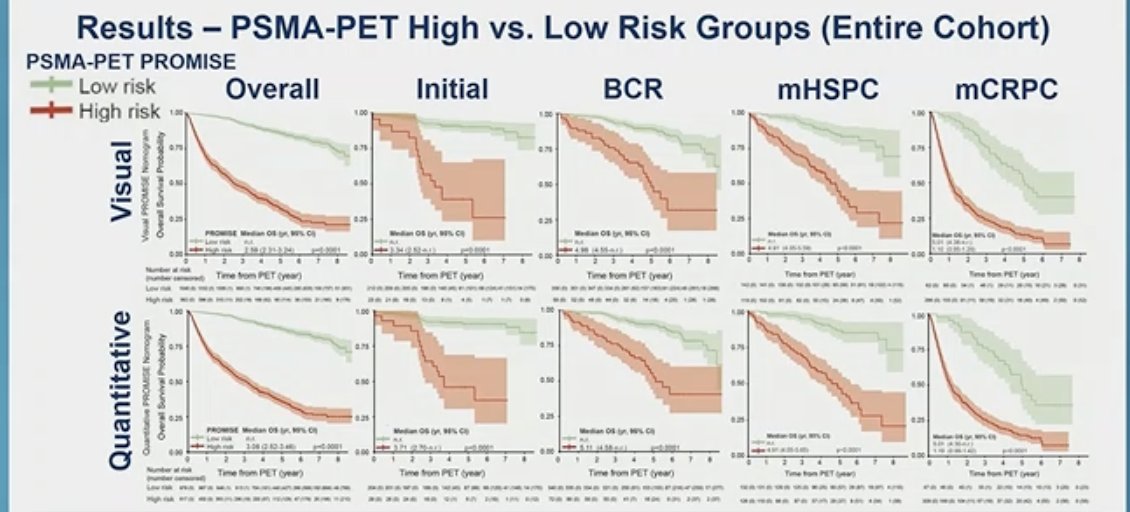
The quantitative nomogram was superior to STARCAP (4) at initial staging (AUC: 0.72 vs. 0.53; p=0.02), to EAU risk score (5) at BCR (AUC: 0.69 vs. 0.52; p<0.001), and to NCCN groups at any timepoint (AUC: 0.81 vs. 0.73; p<0.001).
The visual PSMA-PET nomogram was superior to EAU risk score at BCR (AUC: 0.64 vs. 0.52; p<0.001) and NCCN groups (AUC: 0.79 vs. 0.73 p<0.001). 
In his closing remarks, Dr. Fendler emphasized the following key points:
- The PSMA-PET metrics were internally validated and combined into two nomograms (quantitative and visual), accurately predicting overall survival in men with prostate cancer at any stage of the disease.
- Prediction of overall survival demonstrated superiority in PSMA-PET PROMISE nomograms compared to other available clinical risk tools such as the EAU risk score, NCCN risk groups, and STARCAP.
- Multi-center validation in the PROMISE registry is ongoing.
Presented by: Wolfgang Peter Fendler, MD, Department of Nuclear Medicine, West German Cancer Center, University Hospital Essen, University of Duisburg-Essen
Written by: Julian Chavarriaga, MD – Society of Urologic Oncology (SUO) Clinical Fellow at The University of Toronto, @chavarriagaj on Twitter during the 2024 American Society of Clinical Oncology (ASCO) annual meeting held in Chicago, IL between May 31st and June 4th.
Related content: PROMISE Criteria: Enhanced Survival Prediction in Prostate Cancer with PSMA PET - Wolfgang Fendler
References:
- Eiber M, Herrmann K, Calais J, Hadaschik B, Giesel FL, Hartenbach M, Hope T, Reiter R, Maurer T, Weber WA, Fendler WP. Prostate Cancer Molecular Imaging Standardized Evaluation (PROMISE): Proposed miTNM Classification for the Interpretation of PSMA-Ligand PET/CT. J Nucl Med. 2018 Mar;59(3):469-478. doi: 10.2967/jnumed.117.198119. Epub 2017 Nov 9. Erratum in: J Nucl Med. 2018 Jun;59(6):992. PMID: 29123012.
- Seifert R, Emmett L, Rowe SP, Herrmann K, Hadaschik B, Calais J, Giesel FL, Reiter R, Maurer T, Heck M, Gafita A, Morris MJ, Fanti S, Weber WA, Hope TA, Hofman MS, Fendler WP, Eiber M. Second Version of the Prostate Cancer Molecular Imaging Standardized Evaluation Framework Including Response Evaluation for Clinical Trials (PROMISE V2). Eur Urol. 2023 May;83(5):405-412. doi: 10.1016/j.eururo.2023.02.002. Epub 2023 Mar 17. PMID: 36935345.
- Gafita A, Calais J, Grogan TR, Hadaschik B, Wang H, Weber M, Sandhu S, Kratochwil C, Esfandiari R, Tauber R, Zeldin A, Rathke H, Armstrong WR, Robertson A, Thin P, D'Alessandria C, Rettig MB, Delpassand ES, Haberkorn U, Elashoff D, Herrmann K, Czernin J, Hofman MS, Fendler WP, Eiber M. Nomograms to predict outcomes after 177Lu-PSMA therapy in men with metastatic castration-resistant prostate cancer: an international, multicentre, retrospective study. Lancet Oncol. 2021 Aug;22(8):1115-1125. doi: 10.1016/S1470-2045(21)00274-6. Epub 2021 Jul 8. PMID: 34246328.
- Sung D, Schmidt B, Tward JD. The Ability of the STAR-CAP Staging System to Prognosticate the Risk of Subsequent Therapies and Metastases After Initial Treatment of M0 Prostate Cancer. Clin Genitourin Cancer. 2024 Apr;22(2):426-433.e5. doi: 10.1016/j.clgc.2023.12.014. Epub 2024 Jan 9. PMID: 38290900.
- Preisser F, Abrams-Pompe RS, Stelwagen PJ, Böhmer D, Zattoni F, Magli A, Rivas JG, Dilme RV, Sepulcri M, Eguibar A, Heidegger I, Arnold C, Fankhauser CD, Chun FK, van der Poel H, Gandaglia G, Wiegel T, van den Bergh RCN, Tilki D; EAU-YAU Prostate Cancer Working Group. European Association of Urology Biochemical Recurrence Risk Classification as a Decision Tool for Salvage Radiotherapy-A Multicenter Study. Eur Urol. 2024 Feb;85(2):164-170. doi: 10.1016/j.eururo.2023.05.038. Epub 2023 Jun 22. PMID: 37355358.