Figure 1- Monthly and median costs of cancer drugs at the time of FDA approval:
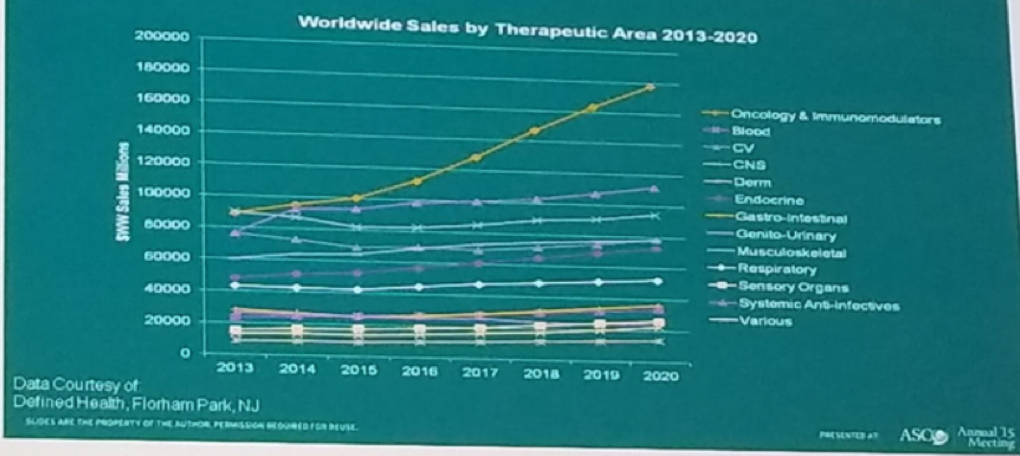
Oncology is a leading driver of growth in biopharma when compared to other therapeutic areas, as can be seen in figure 2. In addition to that, the prices of these oncology drugs vary considerably around the world. It is astounding to see that the monthly drug prices in the US are the highest when compared to other countries in the world, as seen in figure 3.1
With all the money that is invested in these drugs, it is quite surprising to see that their added benefit, regarding survival, has not been most influential. In the ten years of drug approvals between 2003-2013, the drugs that have been approved have increased the overall survival rate by an average of 3.43 months (2) of which:

Figure 2- Oncology is a leading driver of growth in biopharma:

Figure 3 – Patented retail drug prices in various countries:
To try and decrease the costs associated with these drugs, we first need to understand and correctly analyze the cost-effectiveness of each drug. There are various ways to analyze cost-effectiveness. These include:

Table 1- ICER PER QALY – various examples:
With all the money that is invested in these drugs, it is quite surprising to see that their added benefit, regarding survival, has not been most influential. In the ten years of drug approvals between 2003-2013, the drugs that have been approved have increased the overall survival rate by an average of 3.43 months (2) of which:
- 43% increased overall survival by more than three months
- 11% increase overall survival by less than three months
- 30% did not increase overall survival

Figure 2- Oncology is a leading driver of growth in biopharma:

Figure 3 – Patented retail drug prices in various countries:
To try and decrease the costs associated with these drugs, we first need to understand and correctly analyze the cost-effectiveness of each drug. There are various ways to analyze cost-effectiveness. These include:
- Cost per year of life
- Cost per quality-adjusted life years (QALY) = a year spent in perfect health
- Incremental cost-effectiveness ratio (ICER) per QALY - some examples are shown in table 1, demonstrating the significant difference between the ICER per QALY for cataract surgery and Nivolumab therapy for kidney cancer (20000/QALY vs. 226000/QALY).
- Willingness to pay threshold (WTP)
- ICER is often compared to the WTP threshold to calculate cost-effectiveness probability

Table 1- ICER PER QALY – various examples:
The ICER for Nivolumab is $146000/QALY vs. everolimus, while it is $226000/QALY vs. placebo. With a willingness to pay threshold of $100000 to $150000 per QALY, nivolumab is estimated to be cost-effective vs. everolimus, but not cost effective vs. placebo.
The potential ways to increase the value, which is defined as benefit divided by cost, include:
- Increase in efficacy:
- Reduction of off-label use
- Identification and validation of biomarkers to select patients who benefit
- Decrease cost by:
- Lowering price
- Lowering dose
- Shortening the treatment duration
In this short presentation, Dr, Bex stated that financial toxicity of novel treatments is a global problem. Solutions must be sought in better defining the groups who benefit from treatment, fine-tuning their use, and introducing differential pricing to ensure global affordability.
Presented by: Axel Bex, MD, Ph.D., Netherlands Cancer Institute, Amsterdam, the Netherlands
References:
1. Goldstein et al. Oncotarget 2017
2. Salas-Vega et al. JAMA Oncology 2017
Written by: Hanan Goldberg, MD, Urologic Oncology Fellow (SUO), University of Toronto, Princess Margaret Cancer Centre @GoldbergHanan at the 2018 European Society for Medical Oncology Congress (#ESMO18), October 19-23, 2018, Munich Germany


