Thus, accurate prediction of NBGFR after RN can have pertinent implications for the clinical management for some patients with localized kidney cancer. Previous studies have shown that split renal function (SRF) and renal functional compensation (RFC) are fundamentally important for the accurate prediction of NBGFR after RN.2 NBGFR after RN can be predicted using the formula: Preoperative GFR x SRFContralateral x 1.25, where 1.25 reflects the average degree of postoperative RFC after RN in adults.2
However, SRF can be obtained using different approaches. The traditional approach has been the MAG3-based nuclear renal scan (NRS), although substantial concerns regarding the accuracy and subjectivity of NRS have been noted.3 More recently, differential parenchymal volume analysis (PVA) has been explored to estimate SRF and has been shown to be more accurate than NRS. Differential PVA can be obtained using 2 different methods, with the first based on simple linear length/width/height measurements (LWH), as recently reported by Schober and colleagues4. PVA can also be obtained using semi-automated, artificial intelligence-based imaging software, which is more objective and less time consuming.2,4 Which of these methods provides the most accurate estimations of SRF and, by extension, predictions of NBGFR? Is one (or more) of these methods more practical for point-of-care application in clinical settings?
In our study, we compared the three methods (NRS, linear LWH measurements to approximating PVA, and software-derived PVA) for estimating SRF and predicting NBGFR after RN. Briefly, the linear LWH approach requires measurements in three distinct axes from cross-sectional CT/MRI (Figure 1): anterior-posterior (obtained adjacent to the polar line in an axial scan), and medial-lateral and length (both obtained from an image showing maximal parenchyma in a coronal scan).5 Each case takes about 7-8 minutes to obtain SRF using this approach, and there is a relatively small degree of variability in measurement (average discrepancy of 1.5% among independent observers).4
Figure 1: Estimating split renal function using simple linear length-width-height measurements.5 Measurements are made in the length and medial-lateral (M-L) axis from coronal scans (figure 1A-1B), and anterior-posterior (A-P) axis from axial scans at the upper and lower polar lines (Figure 1C-1D). All measurements exclude the central sinus and tumor in order to obtain optimal estimates of parenchymal volumes. The M-L and A-P measurements are obtained adjacent to the polar line above and below the central portion of the renal sinus. Parenchymal volumes are estimated using the formula 0.52 x (average of anterior-posterior) x (average of medial-lateral) x (length).

Software-derived PVA (Figure 2) relies on an automated imaging analysis of cross-sectional CT/MRI to extract tumor and parenchymal features based on contrast densities.2 Occasionally, the investigator may need to modify the extracted tumor/parenchyma due to inclusion of central sinus and/or vasculature by the software. Each case takes, on average, 3-5 minutes to obtain the SRF. The performance of each approach was evaluated with correlation coefficients (r) and mean-squared errors (MSE), among other relevant parameters.
Figure 2: Estimating split renal function using software-derived parenchymal volume analysis.5 The contralateral, tumor-free right kidney (Figure 2A); ipsilateral, tumor-bearing kidney (parenchyma and tumor) (Figure 2B); and tumor alone (Figure 2C) are shown. The software readily provides tumor and parenchymal volumes. In this example, the contralateral, tumor-free kidney (Figure 2A) has a volume of 200 cc; the tumor with kidney (Figure 2B) is 280 cc; and the tumor alone (Figure 2C) is 100 cc. Thus, the differential parenchymal volume analysis would be 200 cc in the tumor-free kidney, and 180 cc in the tumor-bearing kidney; resulting in an estimated split renal function of 52.6% in the tumor-free kidney and 47.4% in the tumor-bearing kidney.

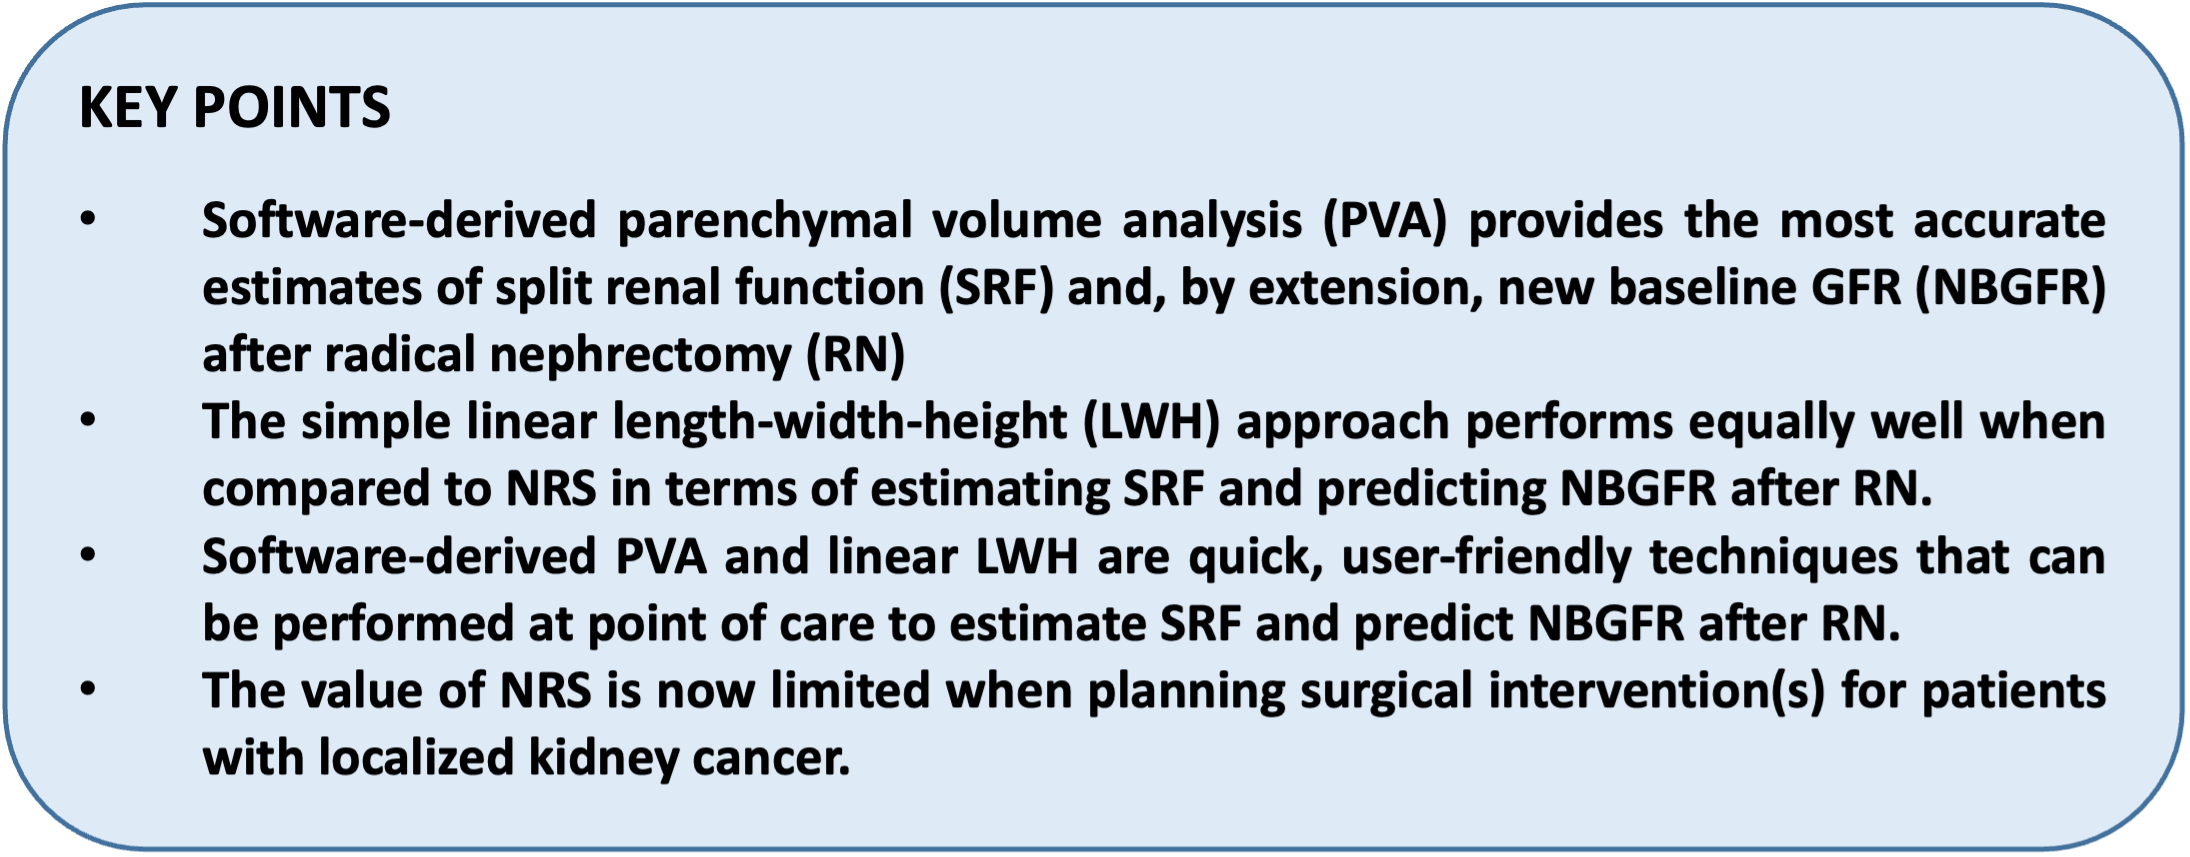
Our key finding is that software-derived PVA provides the most accurate estimations of SRF and predictions of NBGFR. Additionally, the linear LWH approach performs equally well as the traditional NRS approach, yielding very similar outcomes in terms of accuracy and precision with NBGFR predictions.5 Unique advantages of the software-derived PVA and linear LWH approaches are that both can be applied at point of care on routine preoperative CT/MRI imaging, and both can readily provide SRF within minutes. Thus, NRS can generally be avoided during preoperative planning, which not only precludes extraneous radiation exposure associated with NRS, but also reduces the burden from a health care resource utilization standpoint.

Written by: Nityam Rathi and Steven C. Campbell, MD, PhD; Department of Urology, Glickman Urological and Kidney Institute, Cleveland Clinic, Cleveland, OH
Co-Authors: Carlos Munoz-Lopez, Kieran Lewis and Eran Maina; Department of Urology, Glickman Urological and Kidney Institute, Cleveland Clinic, Cleveland, OH
References:
- Campbell, S.C. et al. Renal mass and localized renal cancer: evaluation, management, and follow-up: AUA guideline: Part I. J Urol. 206(2), 199–208 (2021).
- Rathi, N. et al. Predicting GFR after radical nephrectomy: the importance of split renal function. World J Urol. 40(4), 1011–1018 (2022).
- Taylor, A.T. Radionuclides in nephrourology, part 2: Pitfalls and diagnostic applications. J Nucl Med. 55(5), 786–798 (2014).
- Schober, J. et al. MP24-08 Real-time estimation of nephron activity with a linear measurement system (renal-ms) obviates the need for nuclear medicine scans to predict glomerular filtration rate after nephrectomy. J Urol. 207(Suppl 5), e395 (2022).
- Rathi, N. et al. Point of care parenchymal volume analyses to estimate split renal function and predict functional outcomes after radical nephrectomy. Sci Rep. 13(1), 6225 (2023).


